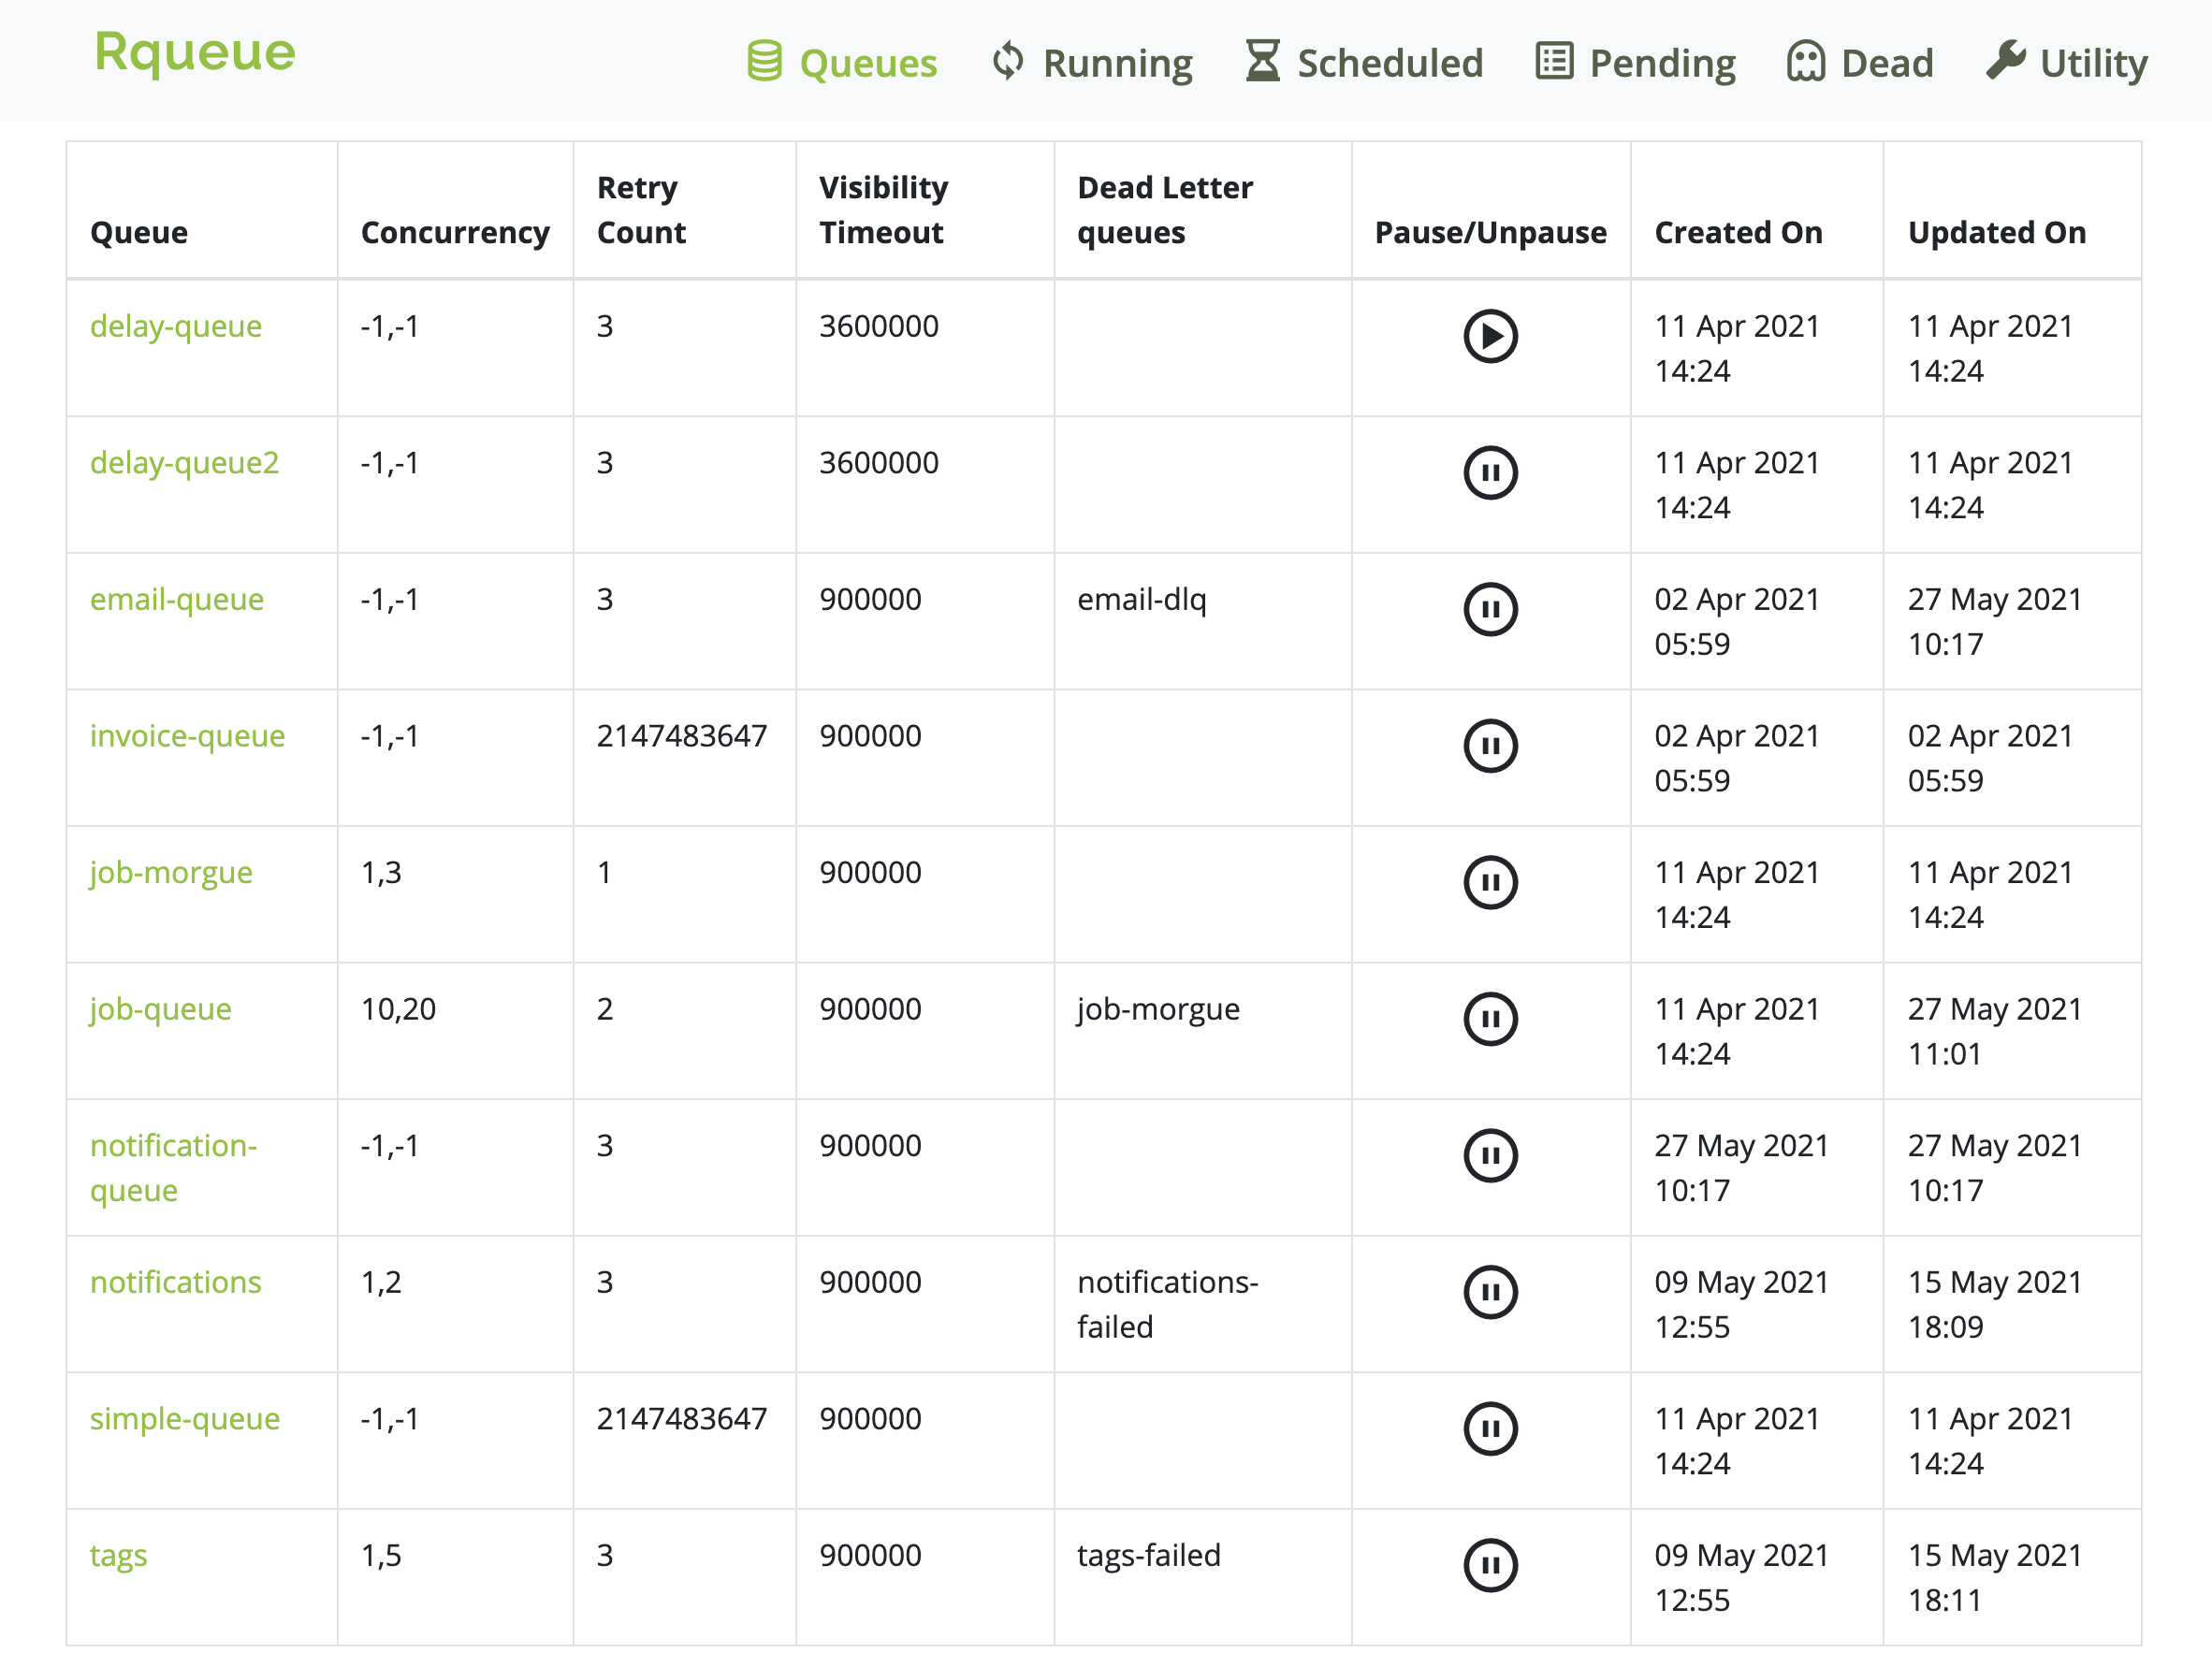
The Rqueue dashboard provides a comprehensive interface to monitor and manage various aspects of message processing.
Dashboard Components
Latency Graph: Displays latency metrics (minimum, maximum, and average) for all queues or specific ones, with a historical view of up to 90 days.
Queue Statistics: Provides insights into message retries, executions, movements to dead-letter queues, and discards due to retry limit exhaustion.
Task Management: Allows for the deletion of enqueued messages, whether they are scheduled, currently running, or waiting in the queue.
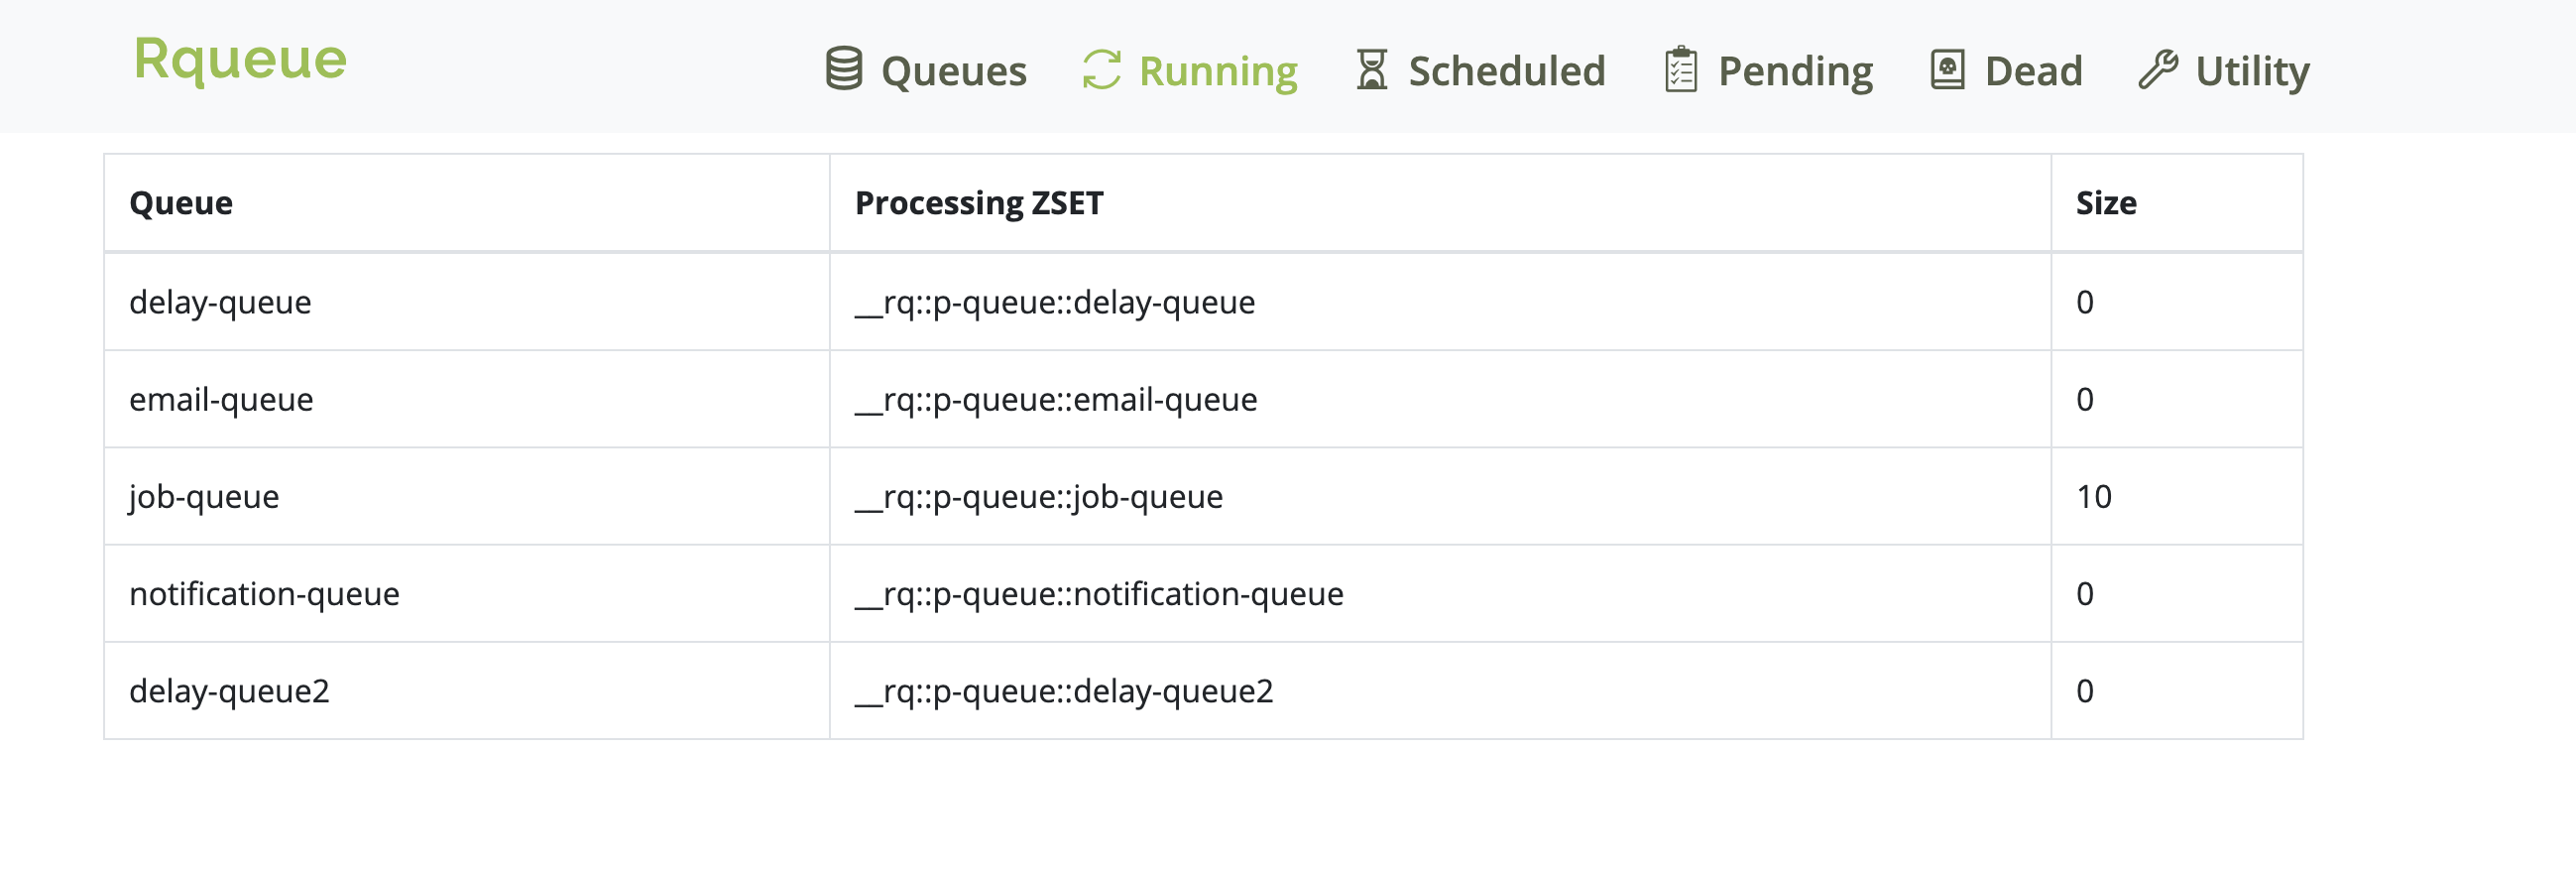
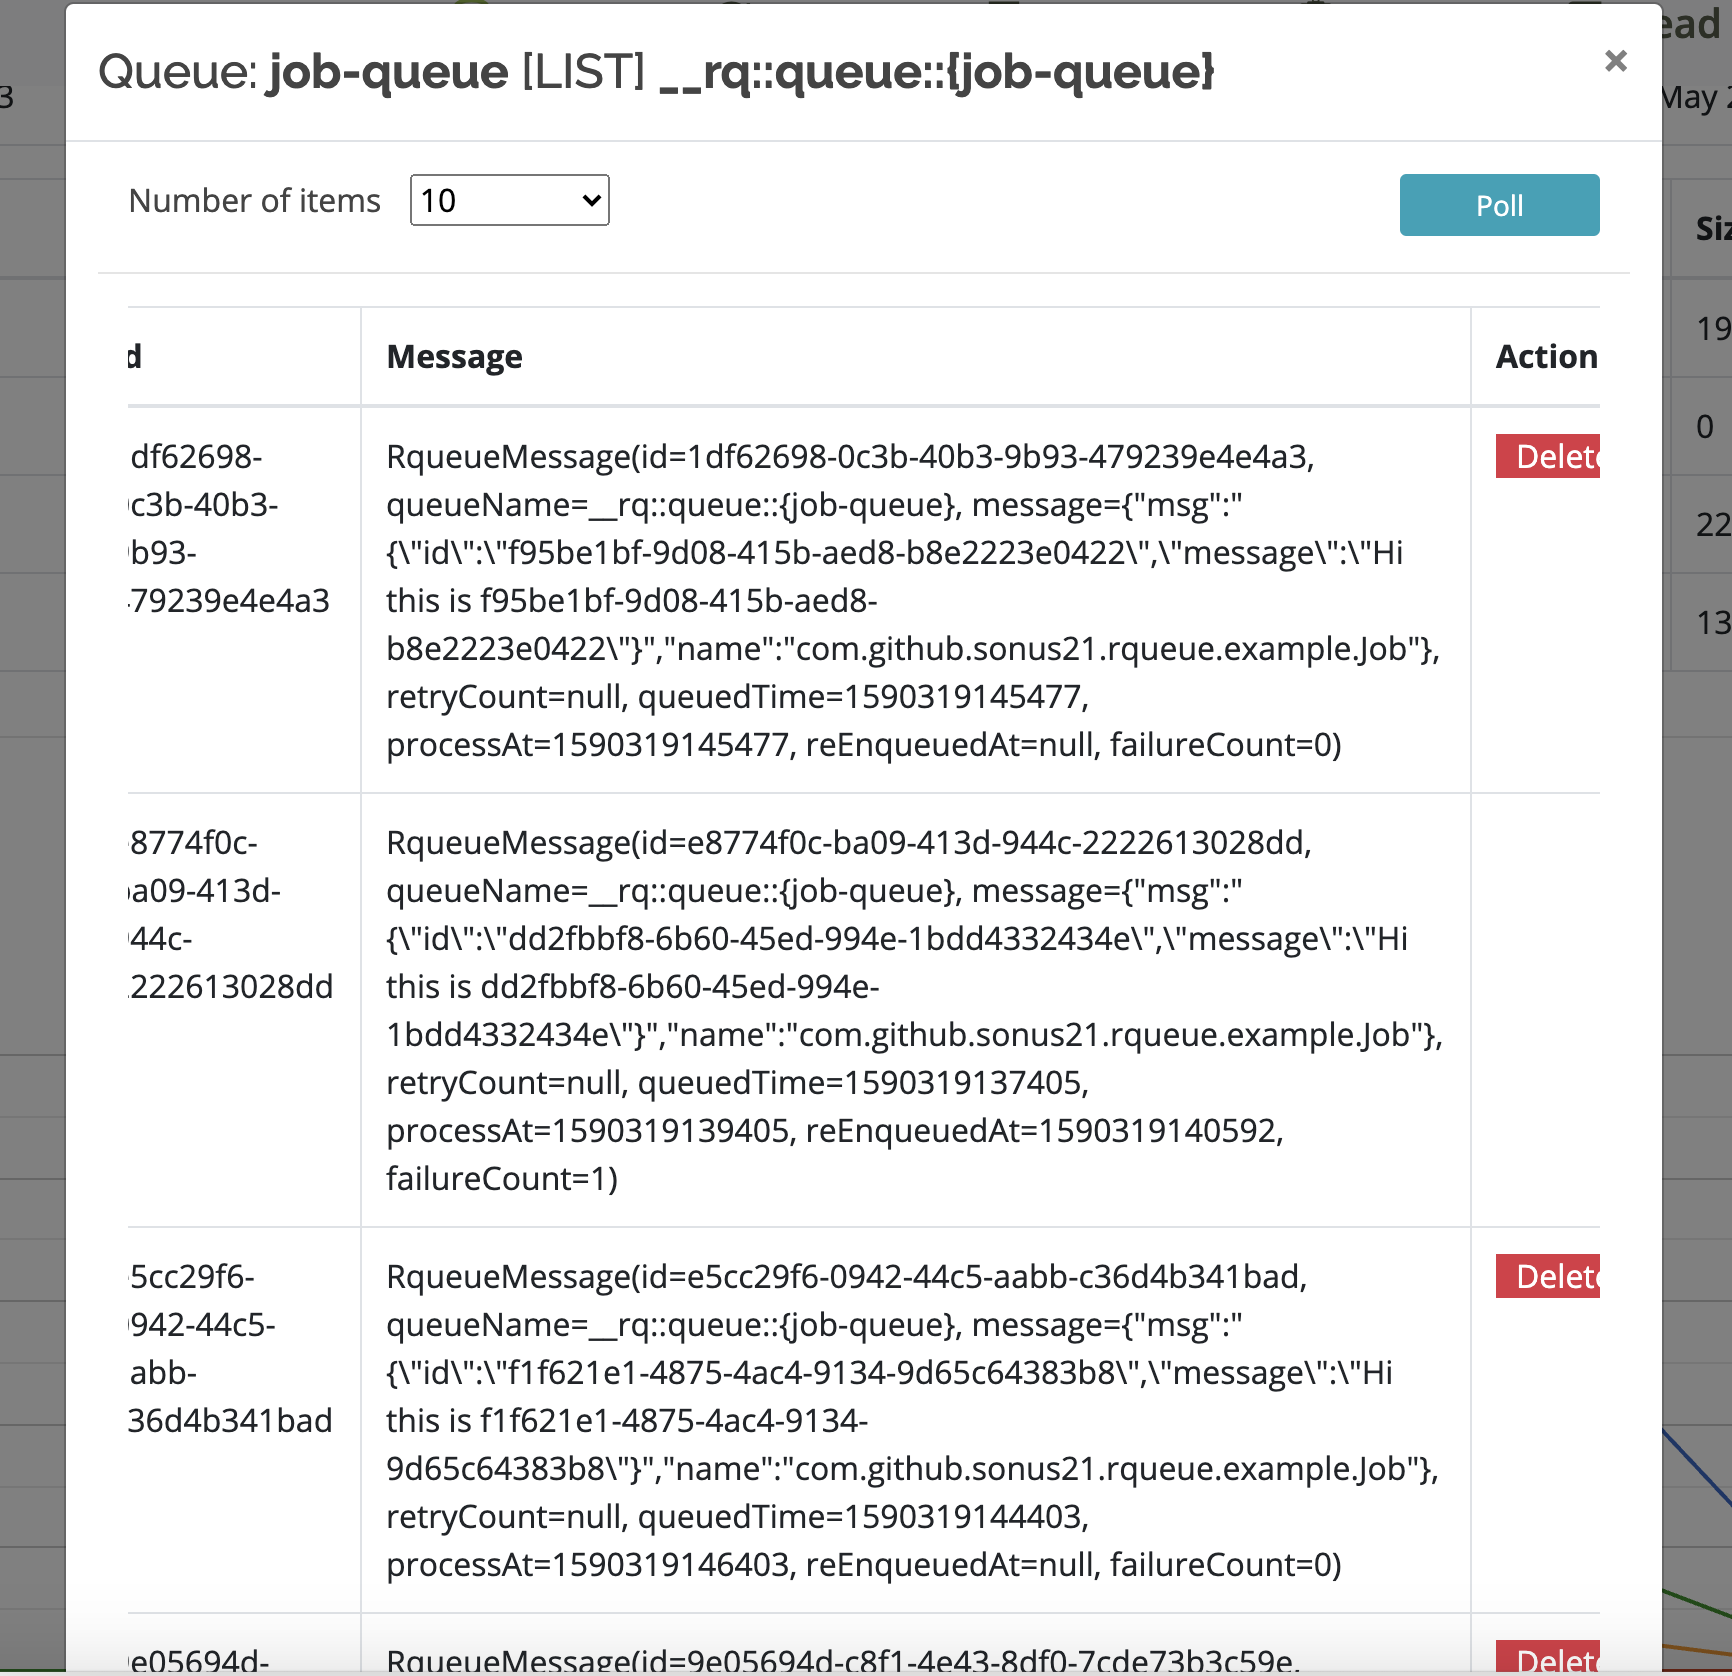
Queue Insight: Offers visibility into the contents of internal queues, similar to an Amazon SQS dashboard.
Task Operations: Facilitates moving tasks between different queues.
Worker Visibility: Shows which worker is polling a queue, when it last polled, and whether the queue recently ran out of execution capacity.
Scheduled Message Recovery: Allows non-periodic scheduled messages to be moved back to the main queue from the dashboard, either at the front or rear.
Access the dashboard at: http://localhost:8080/rqueue
Configuration
Adding Resource Handlers
To handle static resources, configure a resource handler in your MVC configuration.
public class MvcConfig implements WebMvcConfigurer {

  @Value("${rqueue.web.url.prefix:}")
  private String rqueueWebUrlPrefix;

  @Override
  public void addResourceHandlers(ResourceHandlerRegistry registry) {
    if (!StringUtils.isEmpty(rqueueWebUrlPrefix)) {
      registry
          .addResourceHandler(rqueueWebUrlPrefix + "/**")
          .addResourceLocations("classpath:/public/");
    } else if (!registry.hasMappingForPattern("/**")) {
      registry.addResourceHandler("/**").addResourceLocations("classpath:/public/");
    }
  }
}
Path Prefix Configuration
By default, Rqueue endpoints and the dashboard are available at /rqueue/**. They also support the x-forwarded-prefix HTTP header for custom proxy configurations.
You can configure a custom prefix using rqueue.web.url.prefix. For example: rqueue.web.url.prefix=/my-application/.
If you configure a path prefix, you must also ensure that static resource handling is updated accordingly, or the dashboard may not load correctly.
Example URL with a configured prefix: http://localhost:8080/my-application/rqueue
Dashboard Configuration Properties
-
rqueue.web.enable: Enable or disable the web dashboard (default:true). -
rqueue.web.max.message.move.count: Maximum number of messages to move in a single request from the utility tab (default:1000). -
rqueue.web.queue.page.size: Number of queue cards shown per page (default:12). -
rqueue.web.worker.page.size: Number of worker cards shown per page (default:10). -
rqueue.web.collect.listener.stats: Enable collection of task execution statistics (default:false). -
rqueue.web.collect.listener.stats.thread.count: Number of threads used for metrics aggregation. -
rqueue.web.statistic.history.day: Number of days to retain metrics data (default:90). -
rqueue.web.collect.statistic.aggregate.event.count: Number of events to aggregate in a single operation (default:500). -
rqueue.web.collect.statistic.aggregate.event.wait.time: Wait time in seconds for metrics aggregation (default:60). -
rqueue.web.collect.statistic.aggregate.shutdown.wait.time: Wait time in milliseconds for forced aggregation of pending events during application shutdown.
Worker Registry
The dashboard can optionally maintain lightweight worker metadata in Redis to show:
- worker host and process ID
- queue-level polling activity
- recent queue capacity exhaustion
- worker and queue drill-down views
This feature is controlled by the following properties:
rqueue.worker.registry.enabledrqueue.worker.registry.worker.ttlrqueue.worker.registry.worker.heartbeat.intervalrqueue.worker.registry.queue.ttlrqueue.worker.registry.queue.heartbeat.interval
The worker registry is intended for dashboard visibility. Instance-level liveness should still be monitored through your infrastructure or platform health checks.
Queue Explorer Actions
The queue explorer supports queue-specific administrative actions:
- delete pending, running, dead-letter, or scheduled messages
- move messages between Redis collections from the Utility tab
- enqueue scheduled messages back to the main queue
For scheduled messages:
- periodic messages can be deleted, but are not offered queue-to-front or queue-to-rear actions
- non-periodic scheduled messages can be queued to the front or rear of the main queue
Dashboard Screenshots
Latency Graph
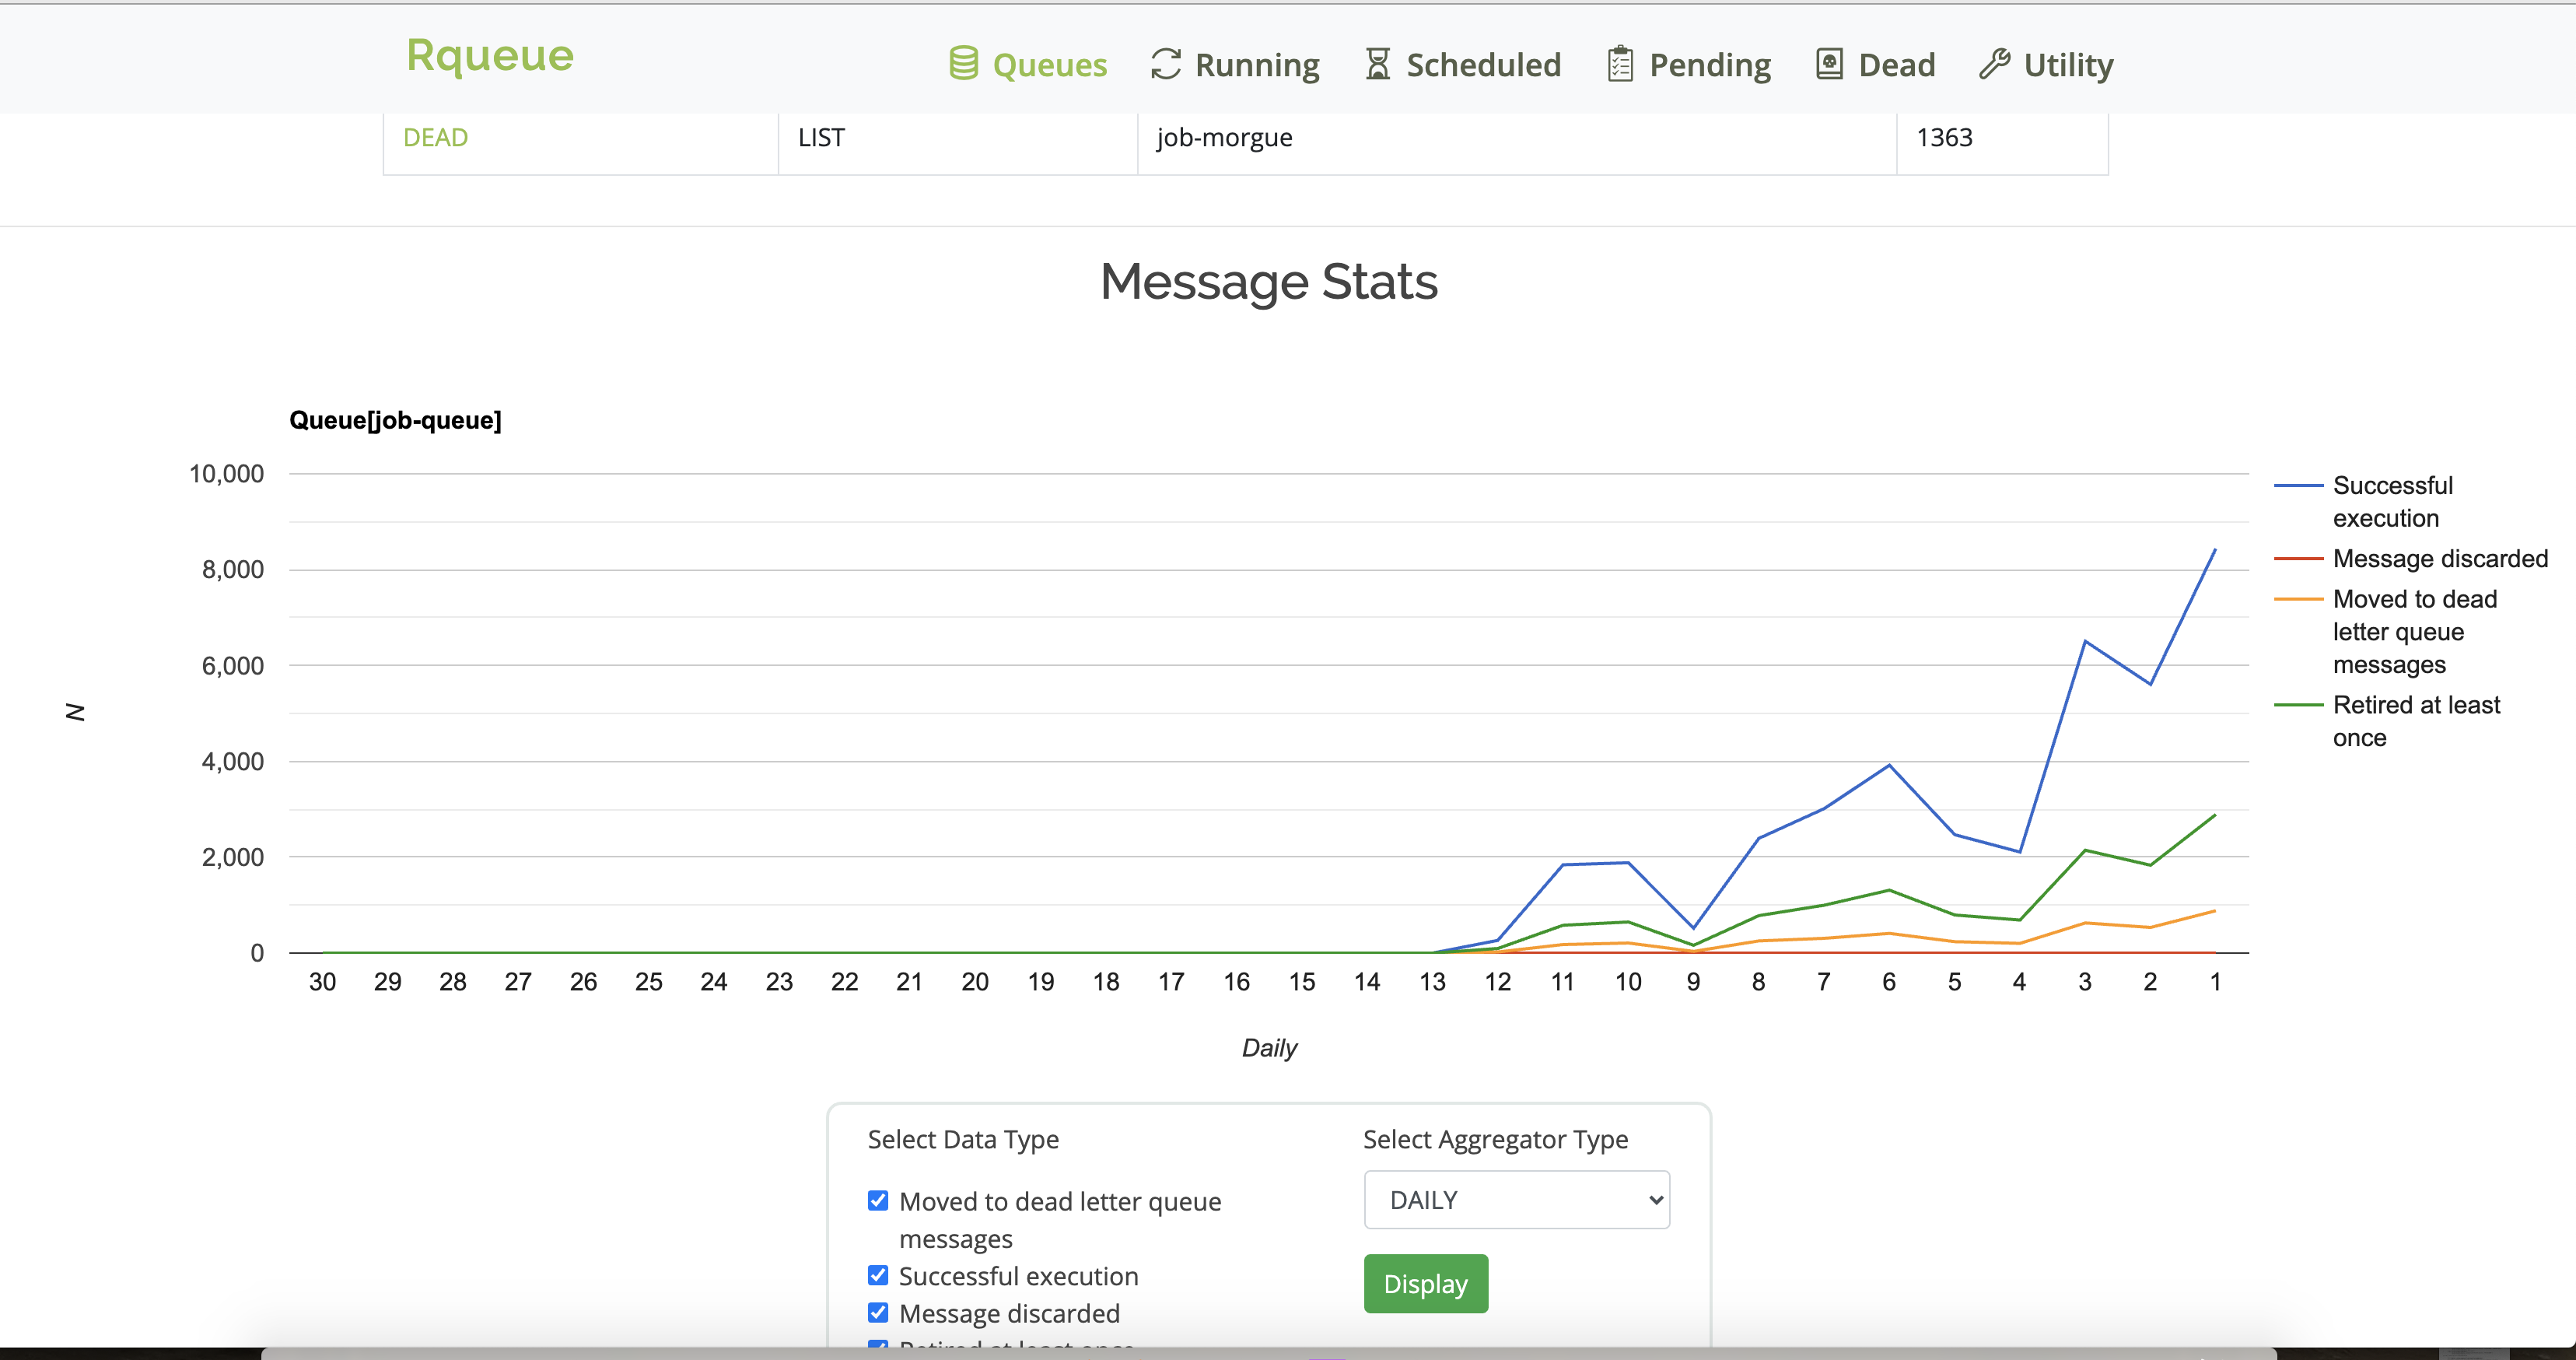
Queue Statistics
Tasks Waiting for Execution
Running Tasks