Monitoring Queue Statistics
Rqueue provides built-in monitoring support through the Micrometer metrics library. These metrics can be exported to monitoring systems such as Prometheus, Datadog, or any other Micrometer-supported backend.
Gauge Metrics
Rqueue exposes several gauge metrics that provide real-time insights into the state of your queues.
| Metric | Description |
|---|---|
| queue.size | The number of tasks currently waiting in the queue. |
| dead.letter.queue.size | The number of tasks moved to the dead letter queue after repeated failures. |
| scheduled.queue.size | The approximate number of tasks scheduled for future execution. |
| processing.queue.size | The approximate number of tasks currently being processed by workers. |
These metrics are essential for tracking queue health and identifying processing bottlenecks or backlogs.
Execution and Failure Counters
Rqueue can also publish execution and failure counters. These counters are disabled by default but can be enabled via configuration.
rqueue.metrics.count.execution=true
rqueue.metrics.count.failure=true
| Counter | Description |
|---|---|
| execution counter | Tracks the total number of successfully executed tasks. |
| failure counter | Tracks the total number of task execution failures. |
These counters help you monitor reliability and set up alerts based on failure rates.
Metric Name Prefixes
By default, Rqueue publishes metrics without a namespace prefix. For example:
queue.size
If multiple components in your system export similar metrics, this can lead to naming collisions or cluttered dashboards.
To group Rqueue metrics under a specific namespace, configure a metrics prefix:
rqueue.metrics.prefix=rq.
With this configuration applied, metrics will be exported as:
rq.queue.size
rq.dead.letter.queue.size
rq.processing.queue.size
Using a prefix helps keep your dashboards, alerts, and monitoring queries organized.
Integration
Spring Boot Applications
To enable monitoring in a Spring Boot application:
- Add the necessary Micrometer dependencies and your chosen exporter (e.g., Prometheus).
- Configure optional metric tags if needed:
rqueue.metrics.tags.<name>=<value>
- Enable execution and failure counters if required.
Spring Applications
For standard Spring (non-Boot) applications:
- Add Micrometer dependencies to your project.
- Define a
MeterRegistrybean. - Configure an
RqueueMetricsPropertiesbean with your desired settings.
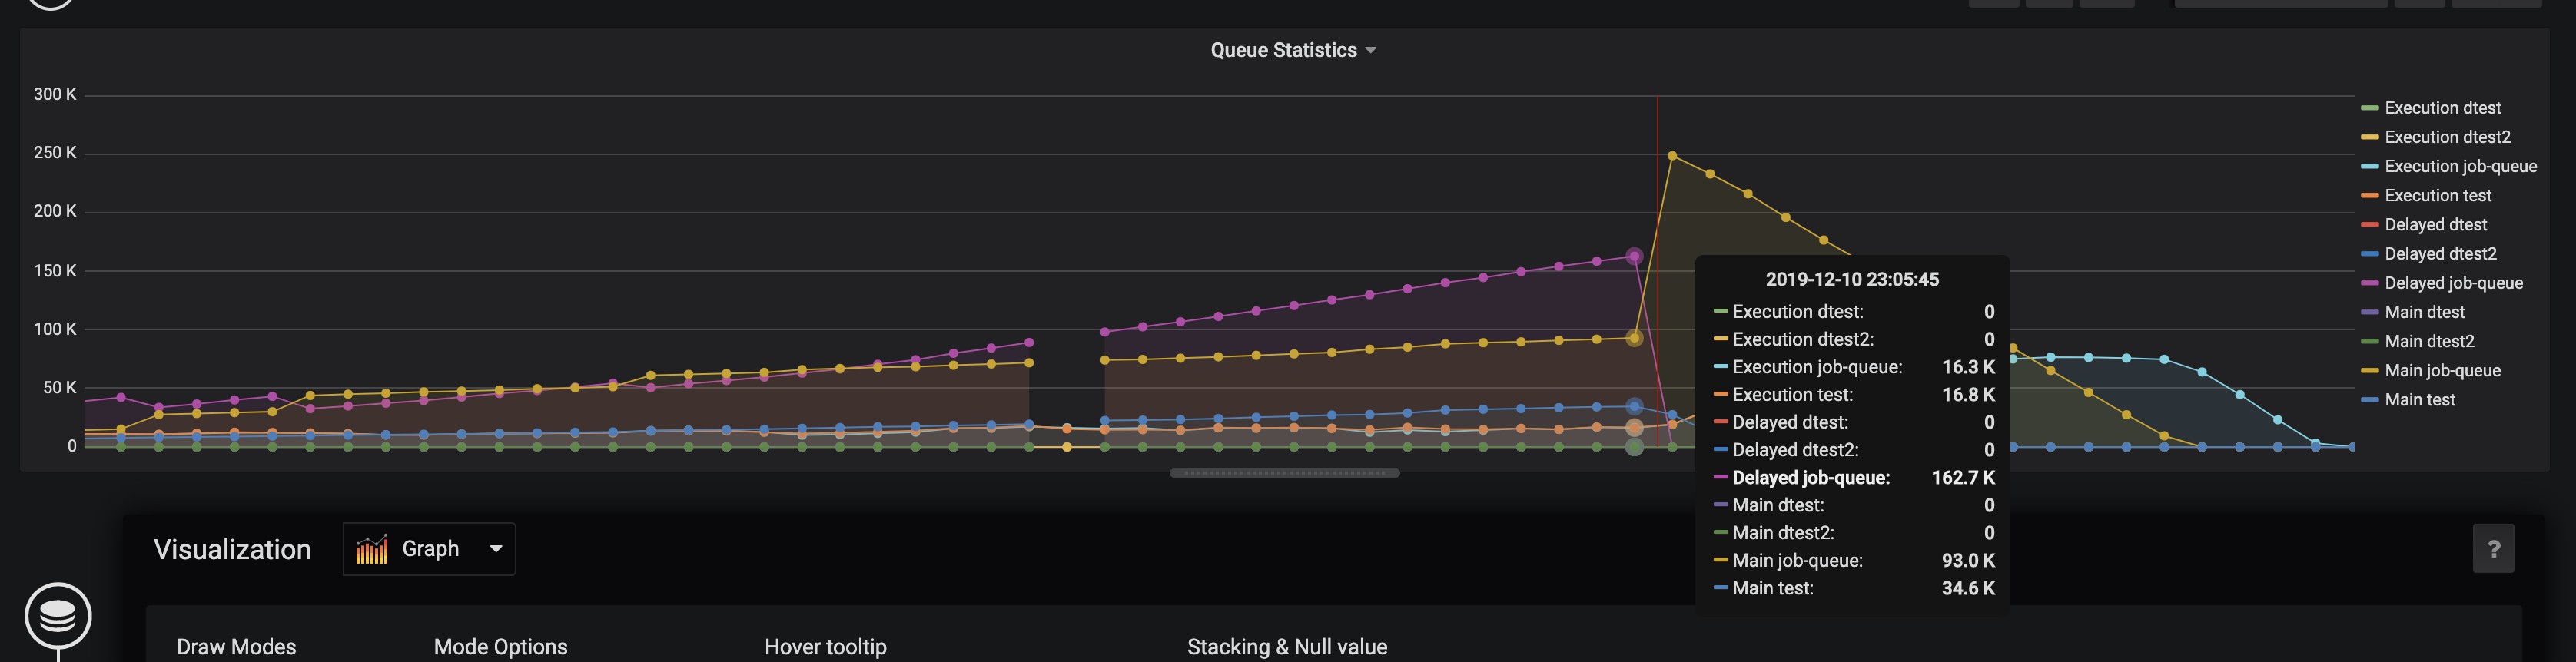
Example Grafana Dashboard
Below is an example Grafana dashboard that visualizes Rqueue metrics.